
Trading Performance Report & Weekly Recap & New Arrow Levels
03-23-2025 - 03-29-2025 - A deeper look into the recent trading performance this week, shared via live trades and data on this blog.

Trading Performance Report
ATTENTION! - If you are new, YOU MUST start here (link below):
Introduction & Guide: "Tracked & Timestamped"
You will NOT understand the context of my analysis and support & resistance levels, without.
Congratulations to “Matt A” who won the raffle this week and has won a paid/Founder subscription value of 7 days.

➡️Watch All My Previous Daily Market Support & Resistance Arrow Predictions Here
All-Time Trading Performance Report
See Full Data At:
https://www.theobeownsya.substack.com
Risk Per Trade: 0.25%
- All Time Trading Statistics -
📅 Trading Start Date: 01-08-2023
↔️ Trading End Date: 03-28-2025
💰 Starting Balance: 🟢 $100,000
💸 Balance Today: 🟢 $7,993,688
💰 Total Gain %: 🟢 7893.69%
🔢 Total Net RR: 🟢 2355
📈 RR Per Month: 🟢 87
🏆 Winrate: 🔴 43%
📈 Profit % Per Day: 🟢 10%
📈 Profit % Per Year: 🟢 3557%
🔢 RR Per Trade: 🟢 0.21
🔢 Profit Factor: 🟢 1.41
🔢 Max Drawdown %: 🟢 14.57%
____________________
🗃️📋 Preliminary Notes 📋🗃️
Before we dive into the levels for the coming week, I want to walk through the results of the predictions shared last week, and how a follower of my work could have gained an insight into how to have accumulated a profitable dataset. I have made ALL of my March free right here
I am very excited for this blog as many of my Long Term & Investment Term trades have given COLOSSAL RR and huge returns, and while I specialize in Short Term trading (scalping, daytrading) - I know I have some followers out there who may not be at the ready for the right timing and precision to follow my trades, so these trades are for you - scroll down to the daily arrows section.
All my trades shared live can be found & verified together by looking at my substack chat in march, as well as the data shared here (link)
Monday - Started off with a -52 RR for the week. The Forex trading led me astray as I got to trade the PMIs with mistakes I don’t usually make. Details to be found in Founders substack chat. This set the stage for some negativity initially for the week as I shared a numerous amount of trades primarily in Forex and Gold. I had an initial analysis coming into the week, as you can see below, taht gold should have been trading lower. For three full days, it was giving me hints and signs it could have been going lower, but it’s massive reluctance to deliver sufficiency in expected targets, turned into a face roll of rocket fuel for the buyside. A combination of the USD weakness and the lack of strong thresholds set for Putins ceasefire negotiation, became the hindsight market “explanations” for this move. Forex, on the other hand, was organic and natural technical analysis oversights that was quick to be reviewed.
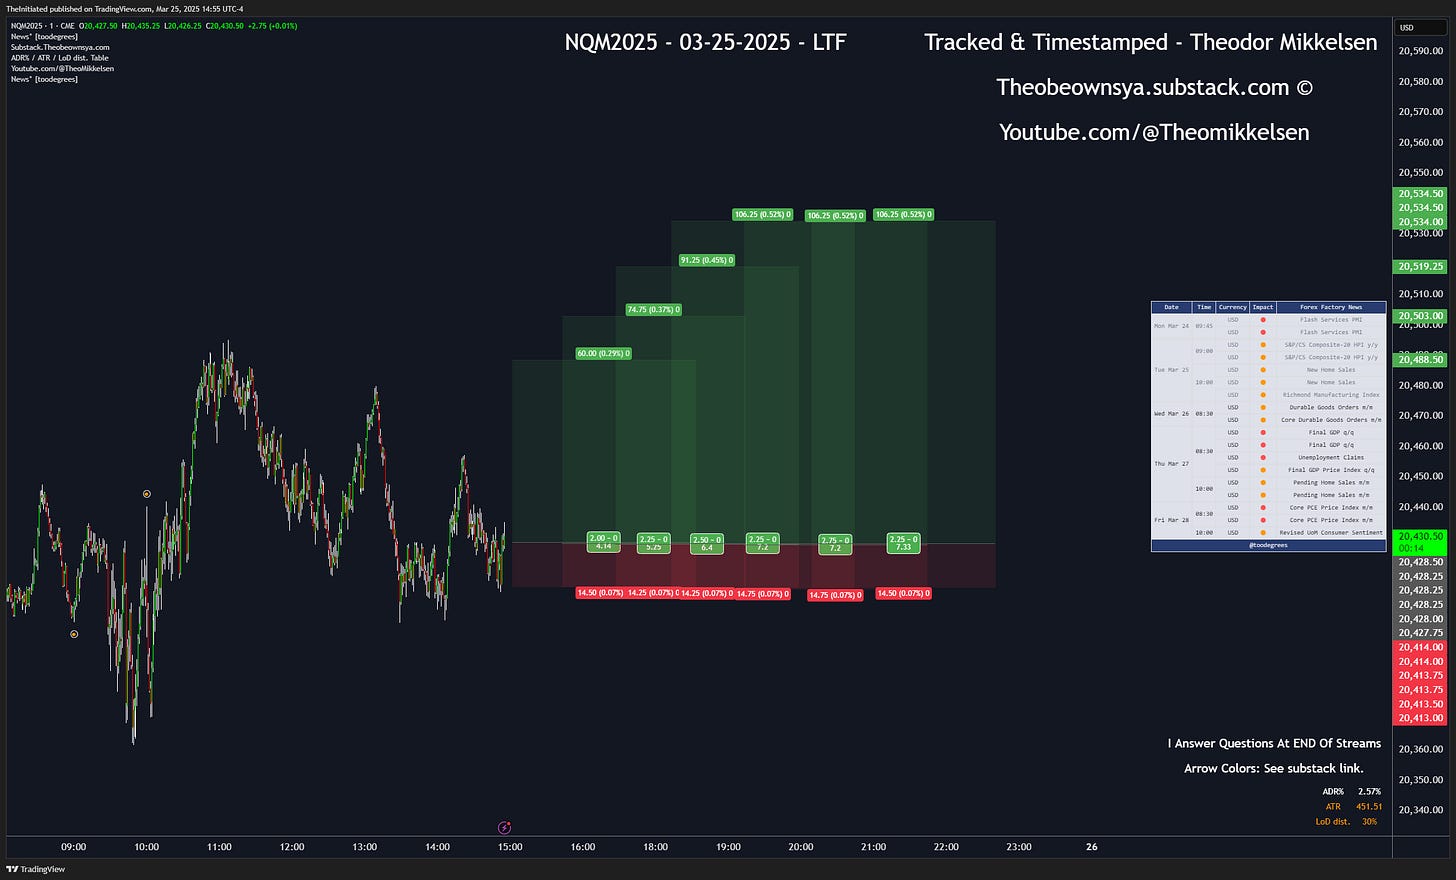
Tuesday - Big Bang day. Huge winners. With initial positioning set on Monday, post PMI releases, and with no need for concern given the relatively lackluster economic calendar for the rest of the week, we managed to deliver more than +100 RR that day, exceeding far beyond my previous record of highest RR in a day set in December 2024. It was particularly this late session NQ trade (You can find the TradingView link in my Substack Chat and the Datasheet), that gained my a huge comeback for the week, with more than 40 RR in a single trade run home: https://www.tradingview.com/x/fnLY7Vbb/
With so many trades constantly shared on the shorter timeframe, and with trades like in the example above not easy to catch as a follower of my work, given the speed and attentiveness required at the charts to be alert, you may find it reconciliation in the fact that you do not NEED to catch that same perfect entry. Wherever the trade is within my move, if I have 6 positions on the trade (leveraged at 6 positions) the probability at the time of my entry that the edge is more than 70%, is in play. Alas, my winrate is yet swinging below the 50% mark, it should be comforting to know that I many times go for high RR returns like this, and you do not need, at all, to catch them all. I have NOT structured the pricing of my blog in the light that you need to catch em all’
For Wednesday-Friday, let us take a look at the individual markets below in my Daily Market Arrow Prediction (DMAP) installment:

💵 💶💷 Forex (DXY) 💵💶💷
Chronological Screenshots Shared In Last 4-8 Blogs:


Key Dollar Index Support & Resistance levels: (TVC)
DXY - Long Term Bullish Above🟩N/A
DXY - Long Term Bearish Below🟥107.661
DXY - Short Term Bullish Above🟢N/A
DXY - Short Term Bearish Below🔴106.275
Please refer to these for EURUSD as well as forex.com data
As you can see, I am beginning to collect a fair bit of screenshots of how the DXY has developed through the last few times I took screenshots and shared them with previous blog releases (see link above for the archive.) I must say, I am VERY satisfied with how I have predicted the development of the USD. March 15 to March 29, a solid two weeks.
I personally entered Long Term & Investment positions into EURUSD based on this analysis shared the last few days and weeks. If you are paid subscriber, you will see my positions live as I take them. But you have access to them, now (although with a worse entry and NO live updates of management as I reserve that for paying subscribers too.)
US yields have been high for long and I am cautiously observing the dovishness that may befall us in the near future, possibly as late as this month, given the inevitable FED watchdogging the collapsing US indices. I believe the USD is pricing this phenomenon in.
📉📈Stocks & Indices📈📉
Chronological Screenshots Shared In Last 4-8 Blogs:


Key Stocks & Indices Support & Resistance levels:
ES - Long Term Bullish Above🟩N/A
ES - Long Term Bearish Below🟥5753
ES - Short Term Bullish Above🟢N/A
ES - Short Term Bearish Below🔴N/A
Please refer to the current front contract on barchart.com or Tradingview.com
03-29-2025 - I am going to walk through my predictions each week real quick:
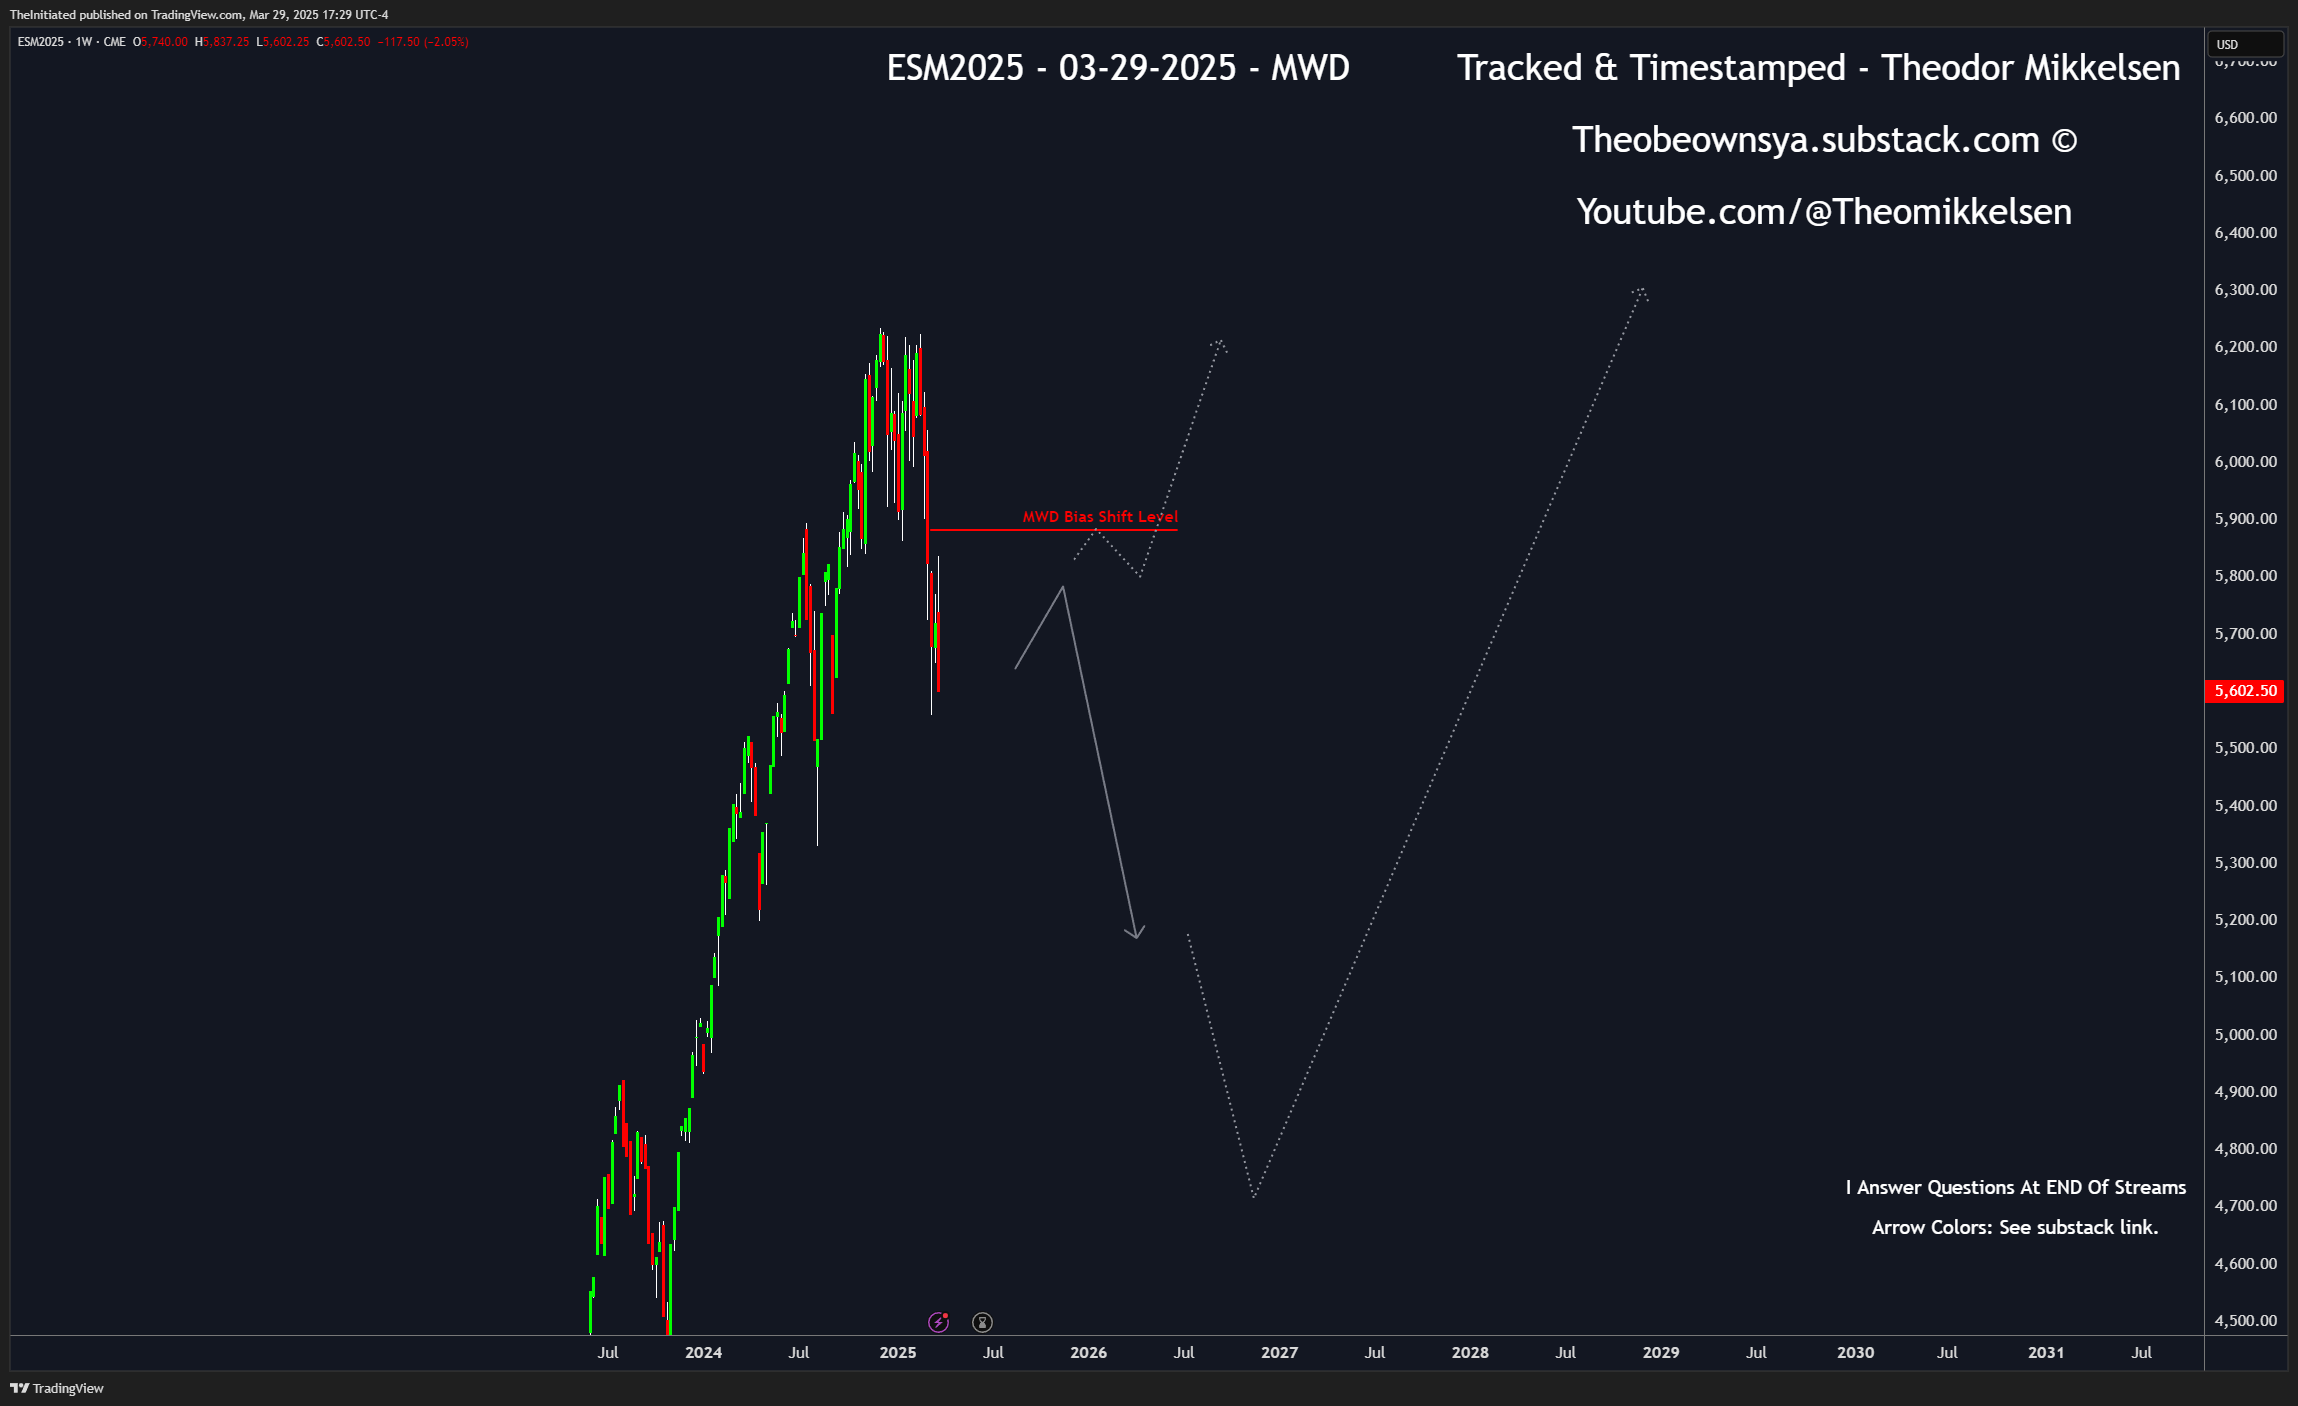
On March 15, two weeks ago, I shared a bearish Long Term grey arrow. I am predicting a move back to the SPY level of 5000 (and similar, at the time of the March contract) - which is a huge psychological support in the investment and media world.
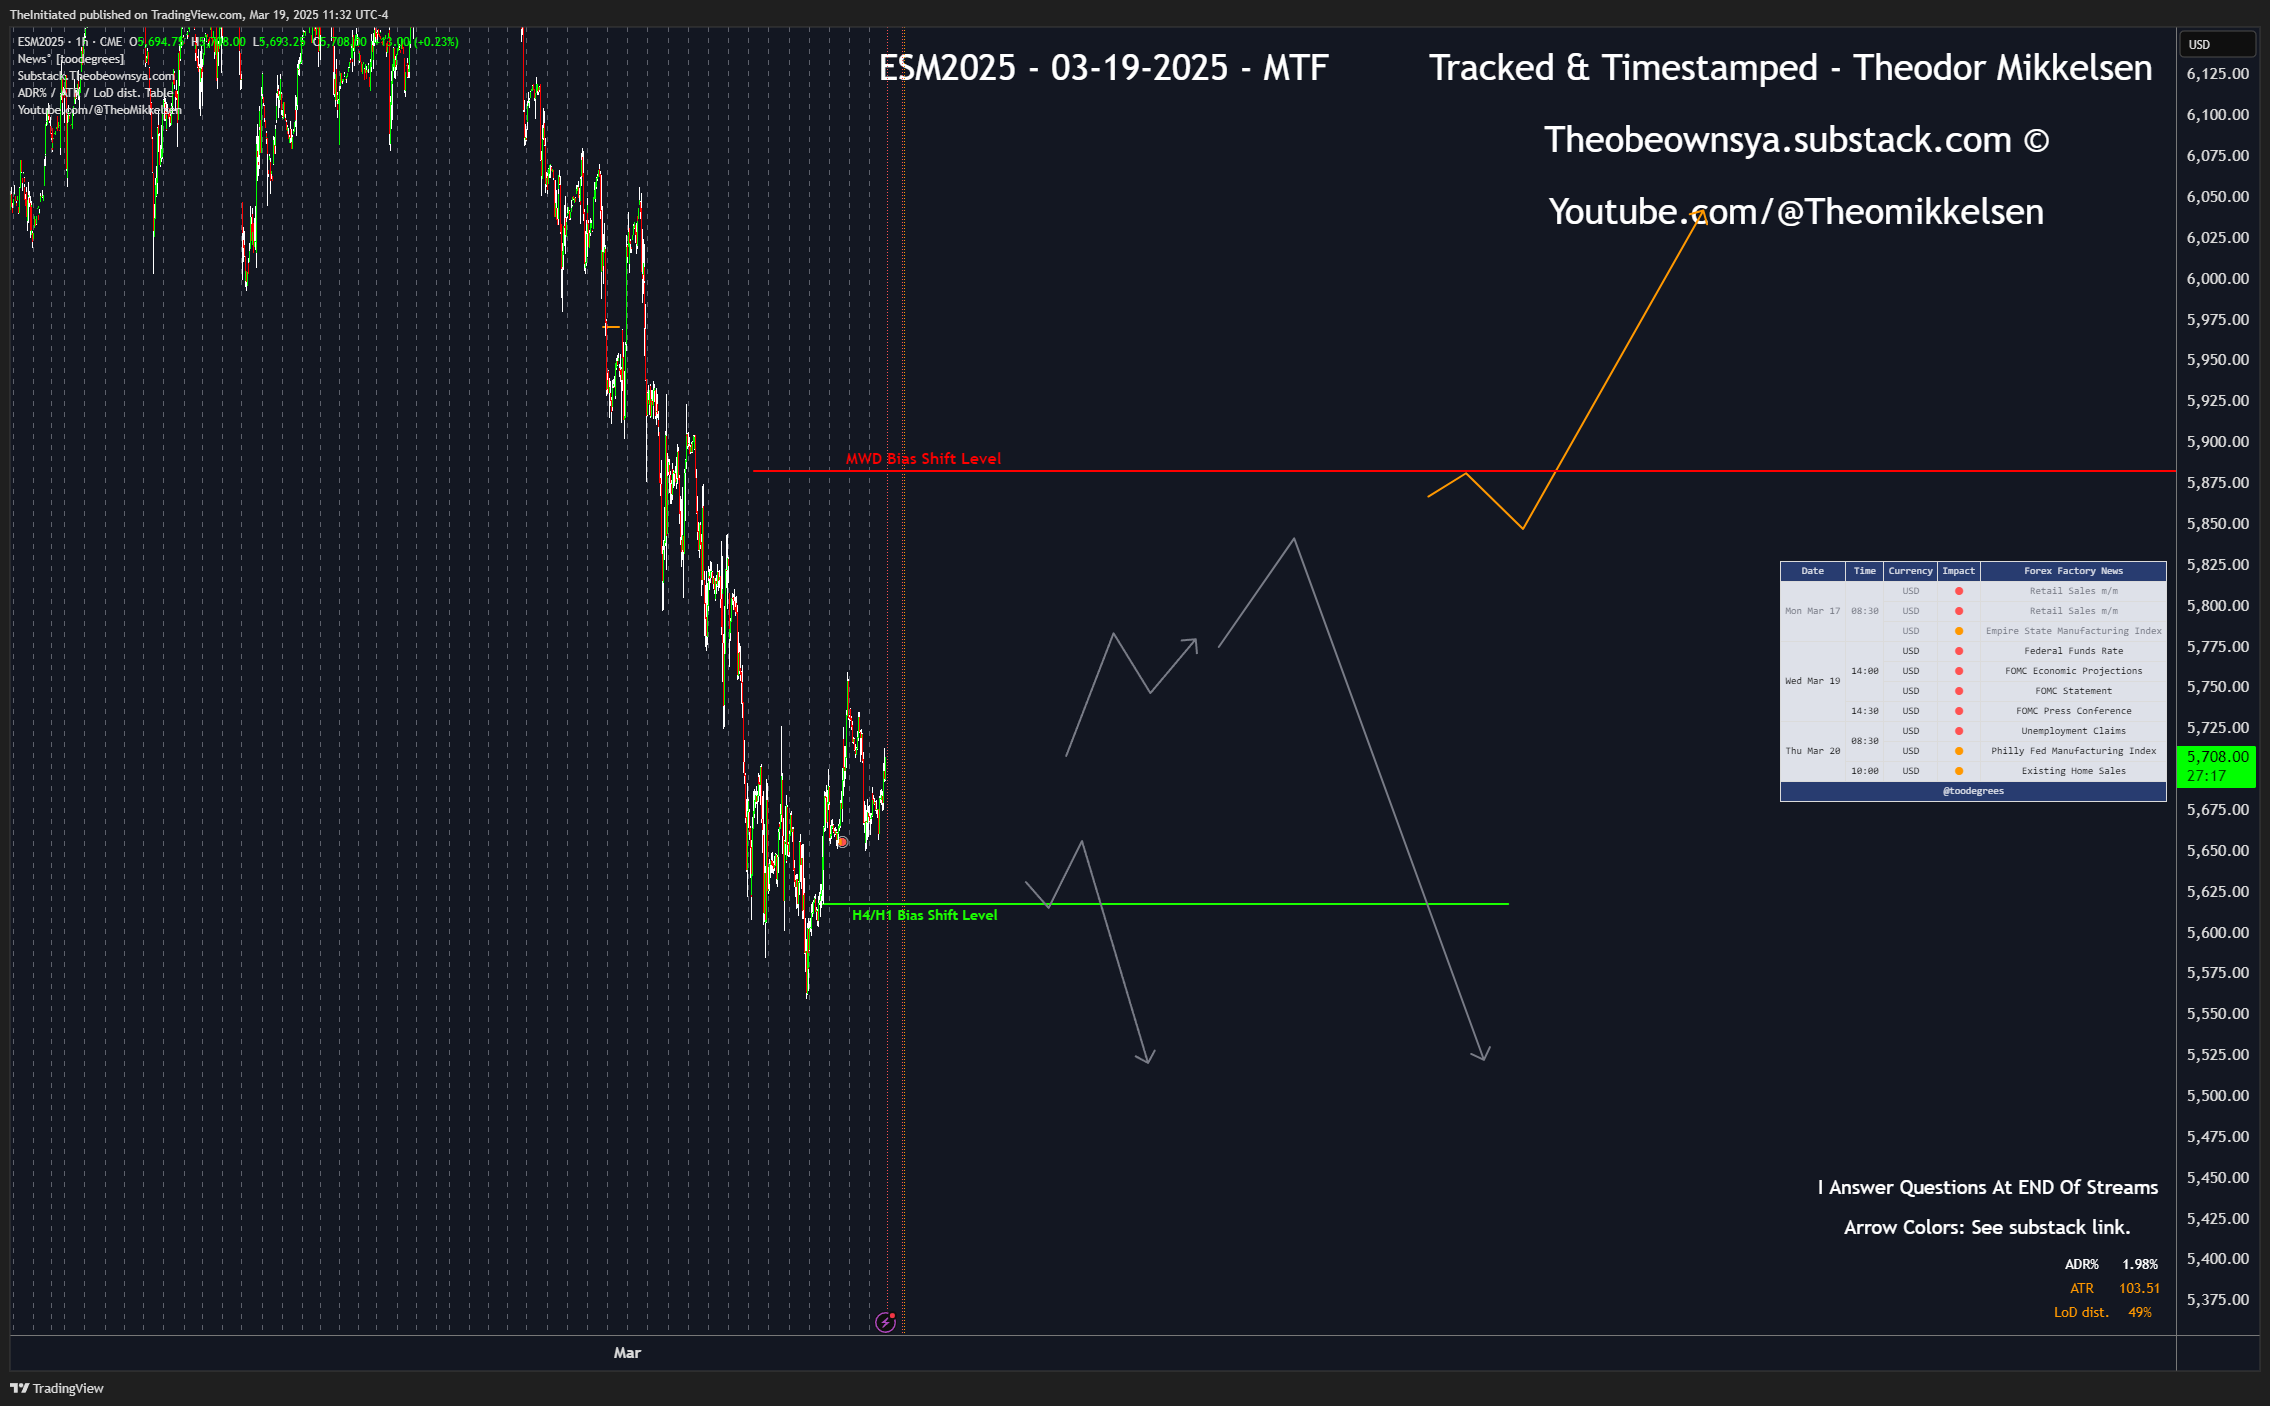
For March 19, I updated the medium term perspective, predicting a grey arrow that the market would go up, and then eventually come lower. At this time, my retracement bias was more flexible.
On March 23, I believed we should be more aggressive in our bearish bias, allowing no higher than 5880 to go lower.
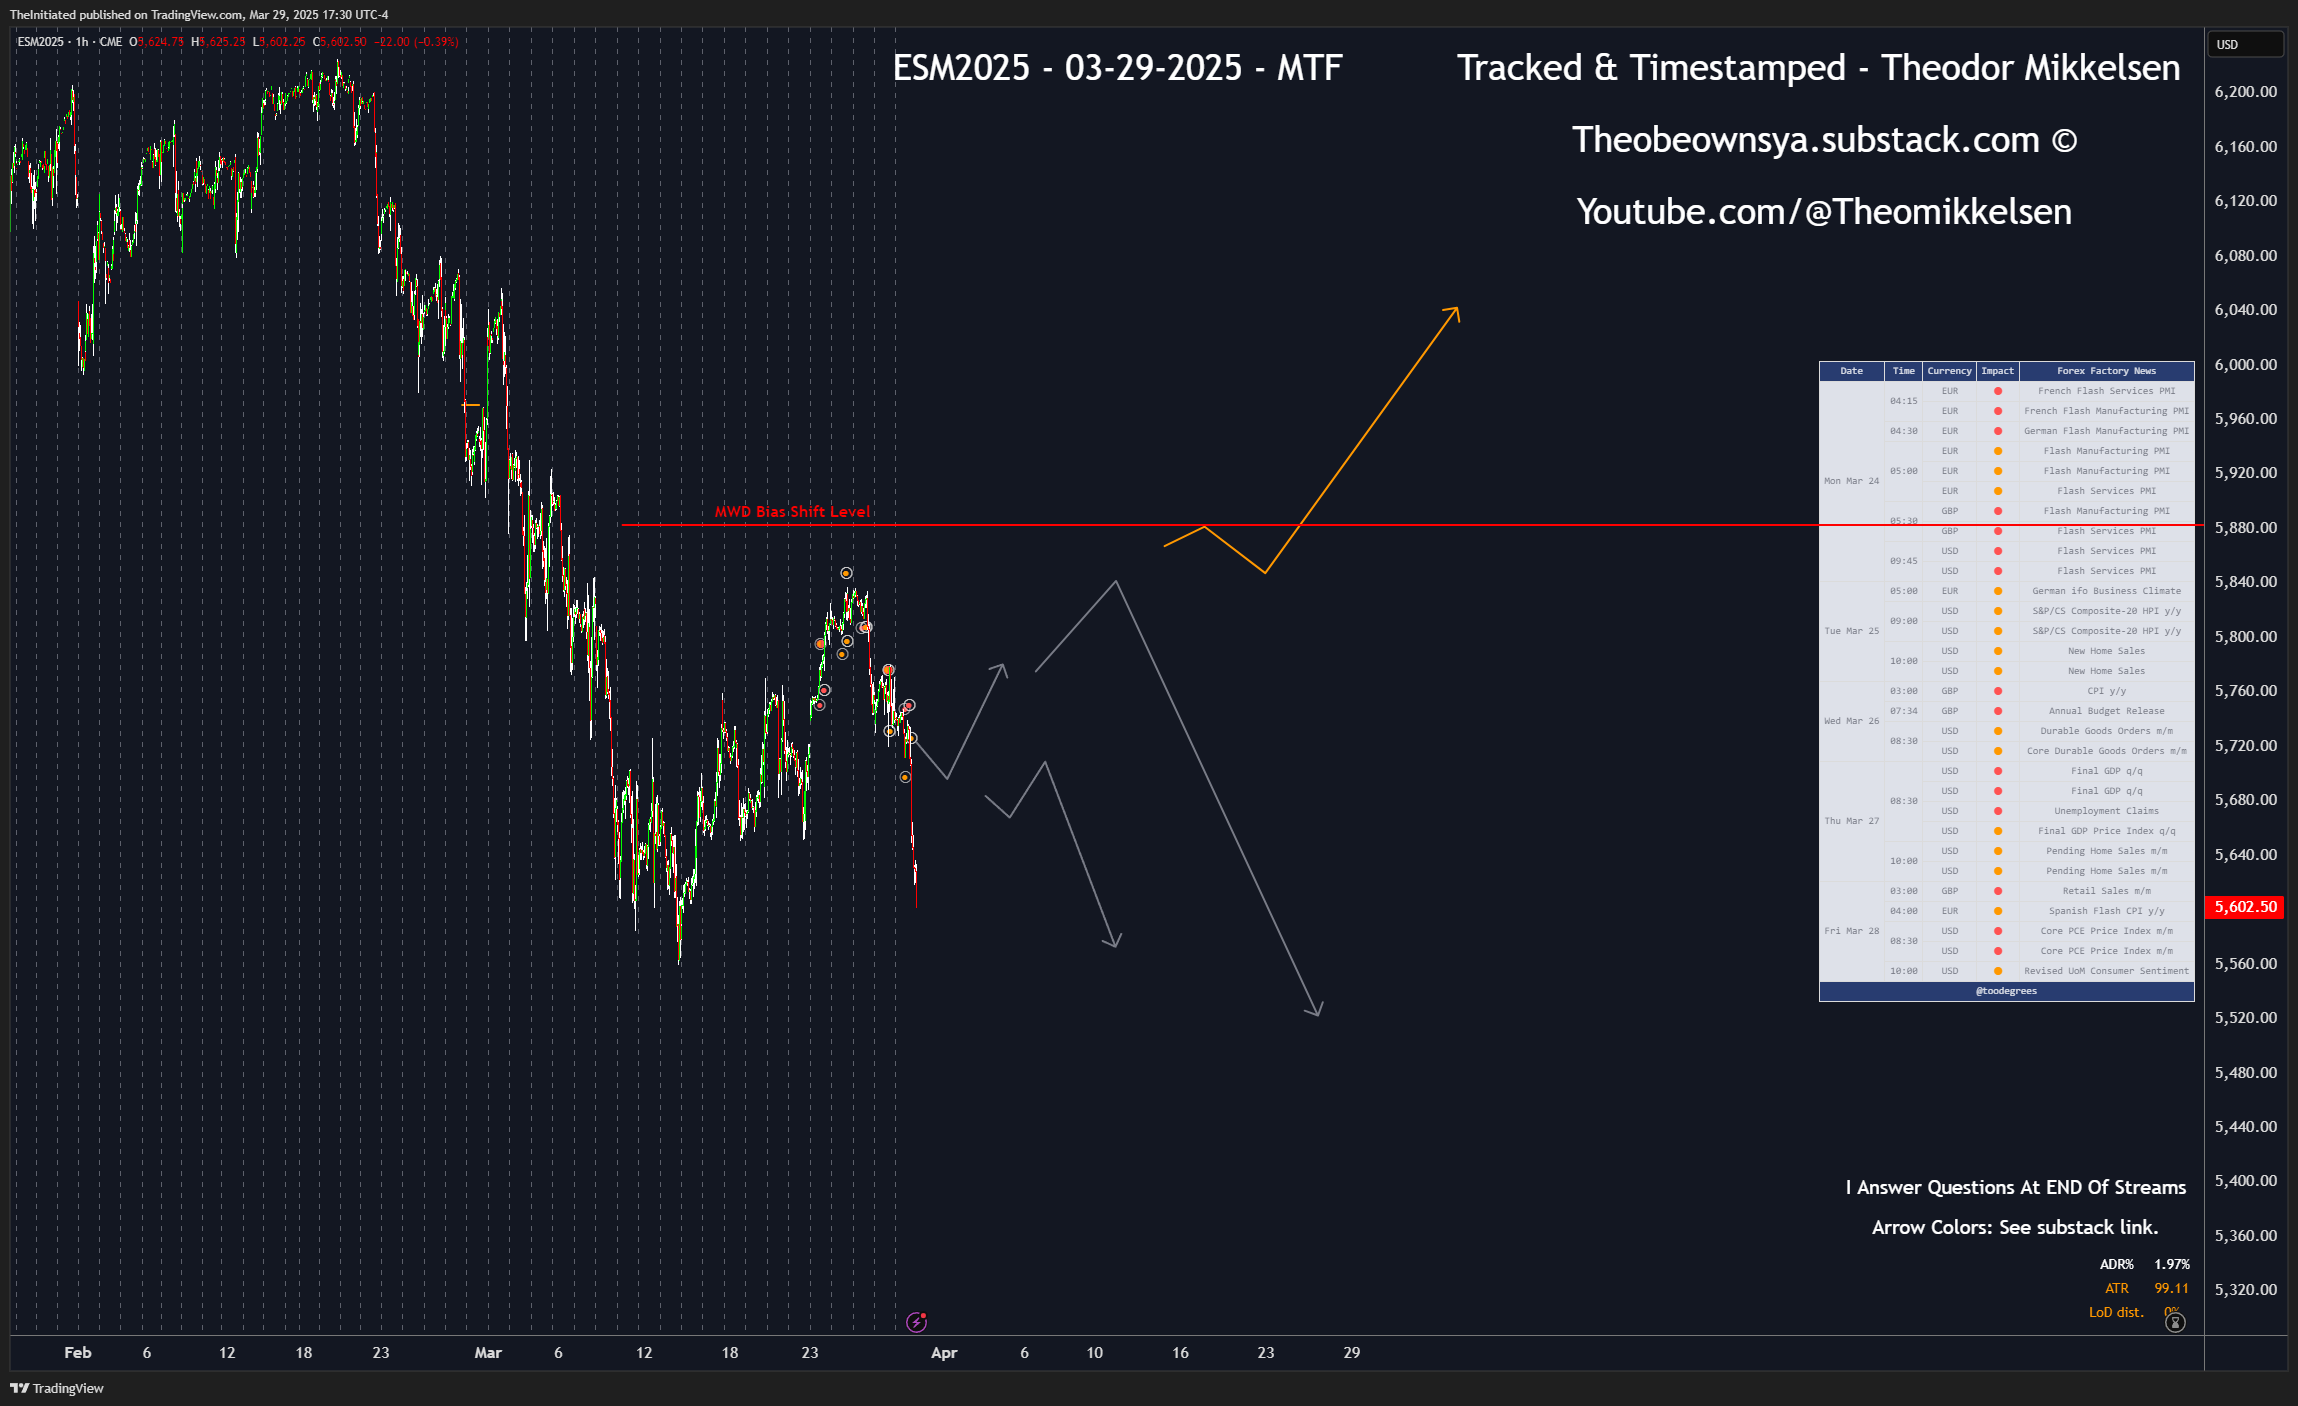
AS EXACTLY predicted, March 29, we saw that my initial bullish bias for the week became later, bearish. Everything has been documented. EVERY blog: Daily Market Arrow Prediction series (scroll up for a link to all blogs) and all my trades, have been based on this analysis. Be mindful the grey arrow pointing up was from the BEGINNING of the week, and the top of grey arrow pointing lower became thee exact top. This was calculated prediction analysis.
To understand the Technical Tools and HOW I can predict these things happening real-time, a Founder membership will gain you insights into my extensive library of lectures and weekly analysis recordings just for that.

At the same time I had been going bearish around the top of my bearish grey arrow, I went in on ALL my accounts: Short Term, Long Term & Investment Term, then shared trades for all kinds of traders in NQ, and as you can see in the screenshot above AND in my data AND in my substack chat, I still have a few of those positions open - based on analysis I did DAYS before they were taken! I am excited to see results in my Investment term account, as the data there, needless to say, could use some fresh high RR returns! Patience is extremely key with these longer term timeframes and I share ALL of my data and trading. Not only do I share which category, short, long or investment term, my trading performance is best at, but also what markets. As a follower of my work, you can chose EXACTLY which markets you want to follow my trades, and which category, all based on publicly shared trading performance data.
⚡⛽Energies⛽⚡
Chronological Screenshots Shared In Last 4-8 Blogs:

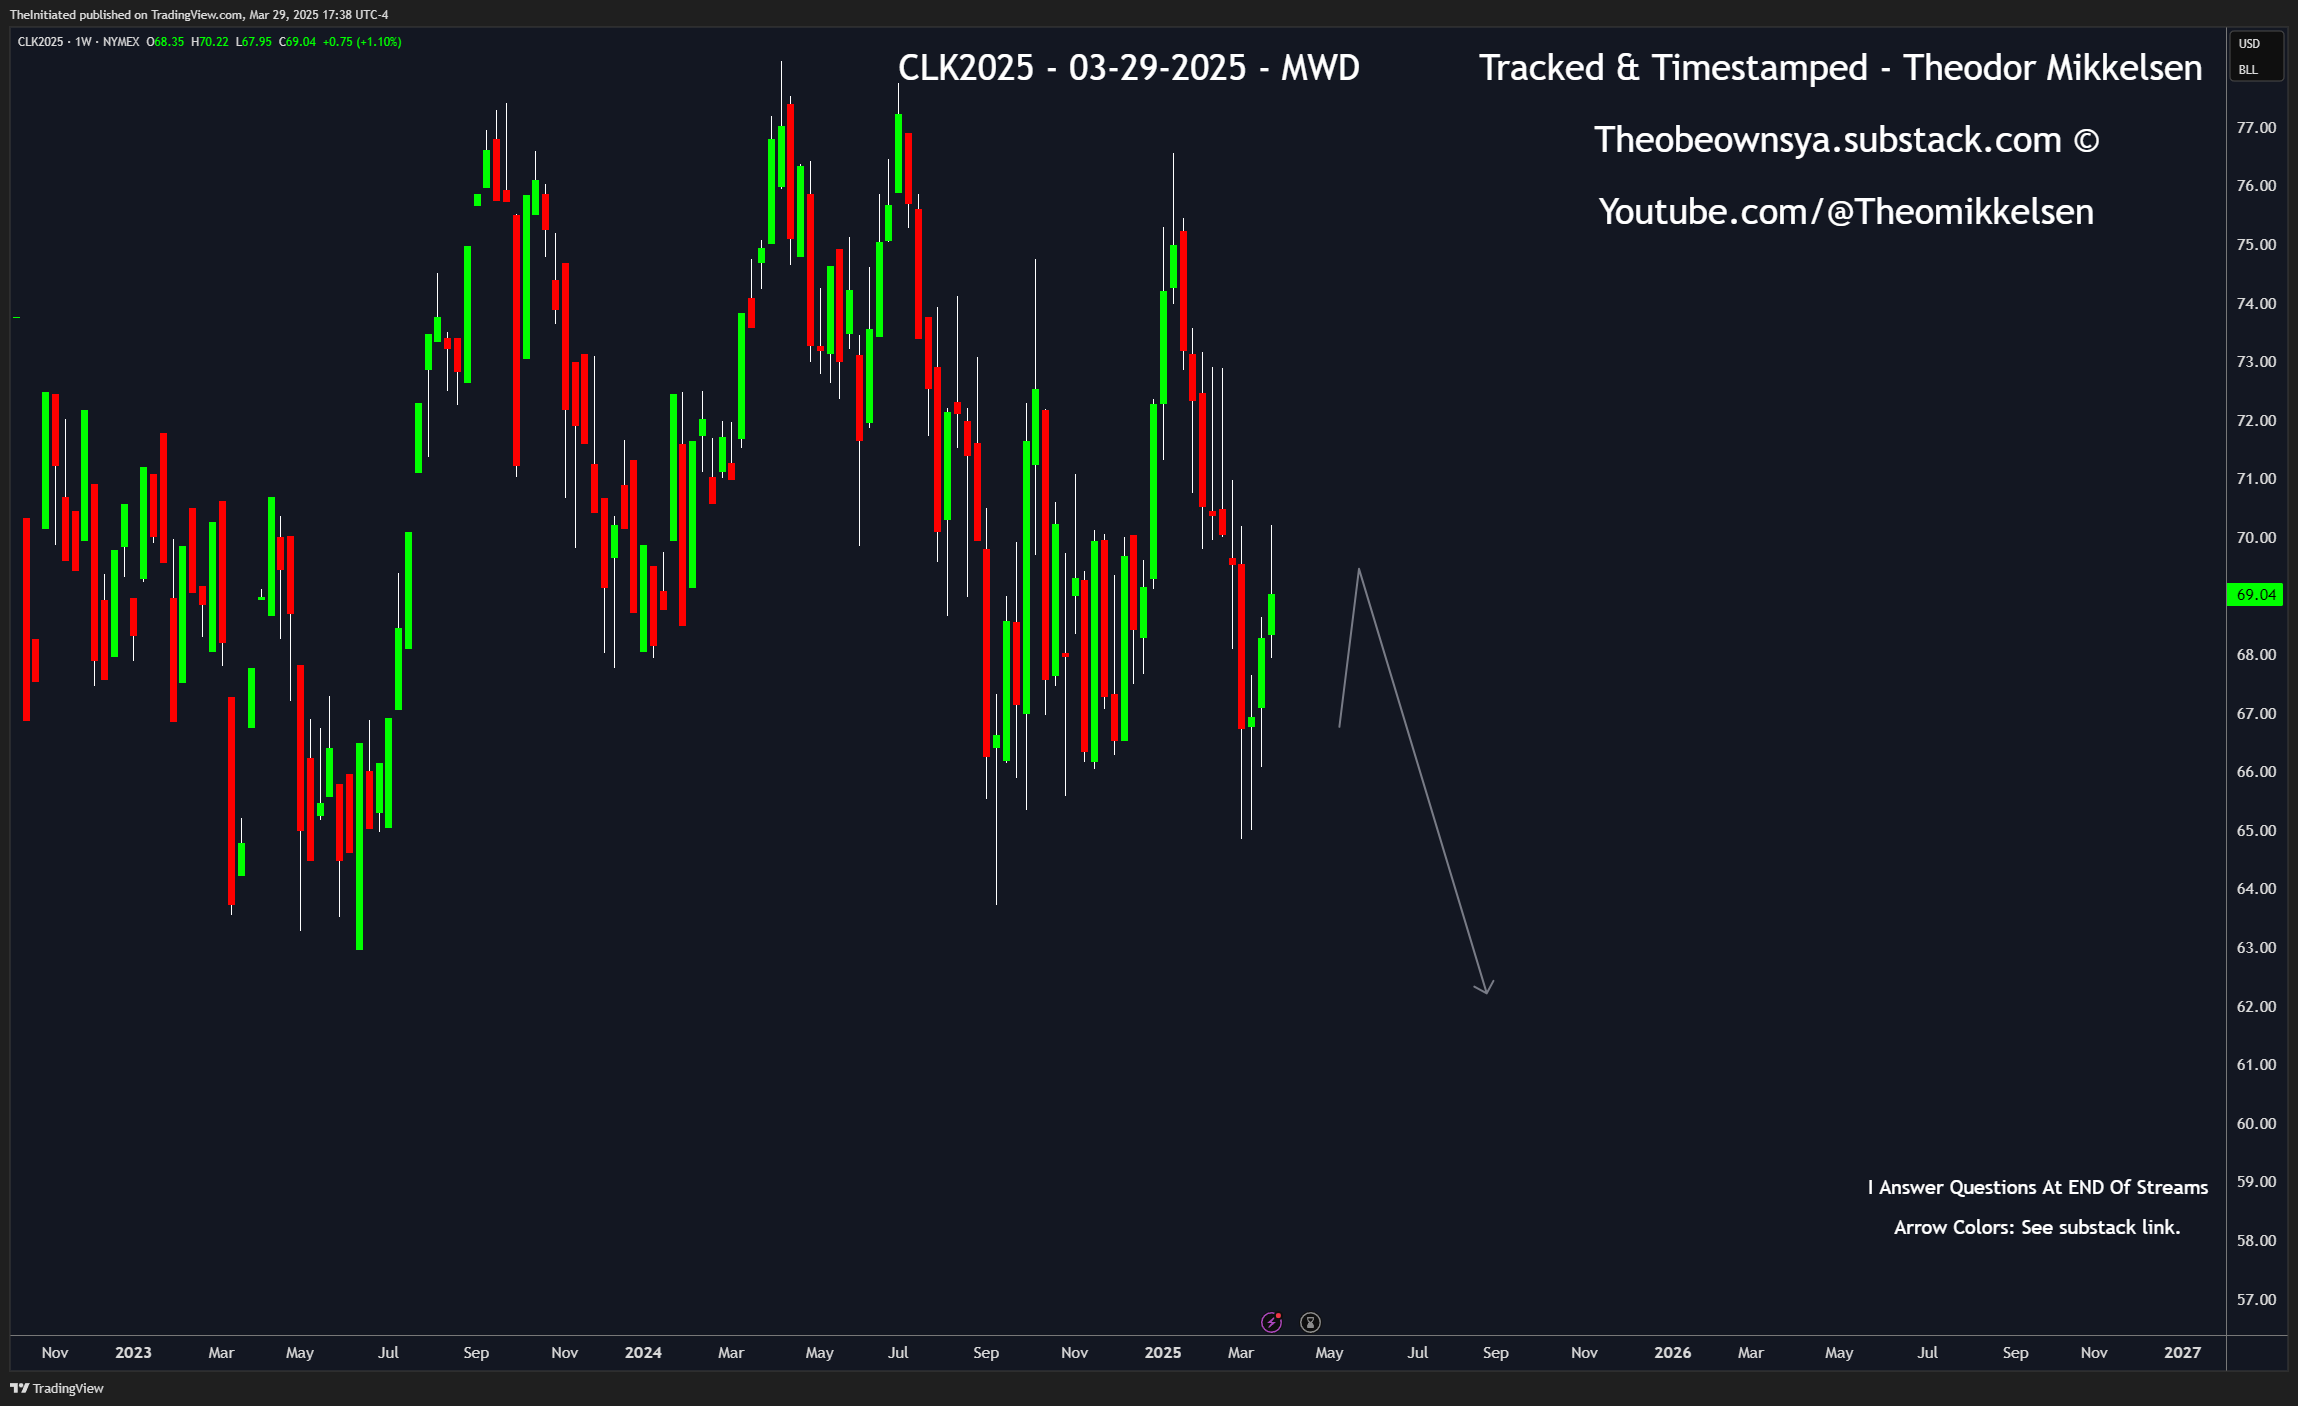


CL - Long Term Bullish Above🟩 N/A
CL - Long Term Bearish Below🟥N/A
CL - Short Term Bullish Above🟢66.97
CL - Short Term Bearish Below🔴69.75
Please refer to the current front contract on barchart.com or Tradingview.com
03-15-2025 - Long term very difficult read, and obviously inflation has left headlines slightly, at least with regards to official releases. We are seeing upmove potential oil via the risks of war escalation, and I am sure there are advanced fundamentals associated with the isolation politics transpiring between EU, East and US, to which international trade of oil can be severely effected.
03-23-2025 I had “unluck” with my short term sellside view on oil. Flat out wrong. I am however not thrown off the bearish bias yet and I think it’s getting ready for a BIG downmove, technically speaking.
While we COULD run higher and stay between my short term levels here, I am generally bearish and I think we can see strong and high-short-advantage short moves if we lose the support level. I am a little bit more adaptive on losing the resistance level.
03-29-2025 - Now, as you can see in my last screenshot as is also shared in my datasheet shared above in the blog, I have some exiting positions short, I am NOT hiding them here on this screenshot. My analysis and recap of oil is that my prediction was almost ROCK SOLID. we came a little higher relative to my bearish resistance level short term at 70.17, and we are still sitting with the current support and resistance level (based on my Founder Membership analysis) albeit SMALL adjustments tot he resistance level.
As for the trades I shared, if you look at my data from this week, you will see that I neglected much buyside trading and primarily wanted to catch a top at the top of my grey arrow, EVEN though we pierced through the resistance level. I did NOT share any longs. This is the advantage of the paid membership. You will know when and how I act, based on my analysis.
🥈🥇Metals:🥇🥈
Chronological Screenshots Shared In Last 4-8 Blogs:


Key Gold GC Support & Resistance levels:
GC - Long Term Bullish Above🟩2699.3
GC - Long Term Bearish Below🟥N/A
GC - Short Term Bullish Above🟢2909.6
GC - Short Term Bearish Below🔴3052.6
Please refer to the current front contract on barchart.com or Tradingview.com
03-23-2025 - I view Gold as in a volatile upside trending condition, meaning it doesn’t have to happen, but while though the Ukraine/Russia (and other sort of swimming-beneath-the-surface conflicts) are stagnating/waiting for key developments. The tariff outcome could largely be baked in here and there has been outbound communications by the Trump Admin that the aggressiveness will be taken down a notch. In line with other market technical expectations, I think gold will fall in like with regular risk-on dynamics, particularly with the economic data set to release this weak, on par with correlations that can normally benefit analysis on Gold.
03-29-2025 - My initial prediction with a 60%+ edge that Gold would go lower, was met with utter despair. I took quite a few losses, but the prediction itself shared here was, unfortuantely, wrong. Nothing to hide, you can see it in my screenshots and blog releases. Currently, this market is still running on the note I shared above on March 23. I feel there is some weakness at 3000 that needs clearing on both the Futures and Cash market, but I simply do not have a Resistance concept to employ here at this time, so this will likely be something, when and if I see it, that will be shared with Paid subscribers.
IF the Russia/Ukraine ceasefire shenanigans flops or IF Trump decides to do some more extensive provocation of allies, Gold could just go full Bitcoin. It is not my neighbourly cup of tea as a marekt to trade, and while I can see some great trades in hindsight, I have not had as much luck with it as with Forex, Equities, Oil or even Crypto. It is very visible in my data.
🗑️💩 Crypto 💩🗑️
Chronological Screenshots Shared In Last 4-8 Blogs:


Key Bitcoin Support & Resistance levels:
BTC - Long Term Bullish Above🟩67480
BTC - Long Term Bearish Below🟥87231
BTC - Short Term Bullish Above🟢N/A
BTC- Short Term Bearish Below🔴87231
Please refer to the current front contract on barchart.com or Tradingview.com & Binance
03-23-2025 The longs I had shared live in my 03-19-2025 post, all went to takeprofits. Where to from here, might the crypto reader ask? Hold my beer. Nothing has really changed from last analysis. levels remain the same.
03-15-2025 - Crypto is in an interesting position where we now have engaged a “pro crypto” US administration, with talks of creating a crypto reserve, and a dogecoin “pumpndumper” selling electric vehicles, despite absence from pumping lately on twitter due to managing 16 year old geniuses in the IRS, may at any point return to cause havoc.
03-15-2025- Sentimentally speaking, I believe the return lower is “classicly” a “crypto-bro” buy the dip. Saylor bullish, Hayes bullish, and Trump will save bitcoin and we can bypass sanctions right? I want to fade this obvious, “irrefutable” narrative, as what actually goes on should be the flipside of the iceberg here.
03-15-2025 - I believe Crypto, and especially Bitcoin, may finally start entering a stage of a never-before-seen “long term” bearish market, that, if alongside a correlation with the Nasdaq (as a beta tech stock correlation), could challenge the whole confidence in crypto as a whole. I don’t think we have historically, in last 12 months, had such sharp upswing from the all-time-high and then moving below 50k, so while the technicalities long term CAN go both ways right now, I think an idea of revisiting 50k, interests me.
With Gamestop announcing strategic buying of Bitcoin akin to Microstrategy, with a absolutely 1-to-1 bitcoin threaded or invested high-cap tech sector bleeding red, it became only natural to me to play some shorts (see the data and screenshot on Binance above) both on the Short term, investment term and long term. Full throttle. We can see on the current price, shared live with Paid subscribers, that the profit exceed 2 RR, and that is across 3 different account categories. Needless to say, I walked through ALL my crypto analysis in my general chat for free and I would encourage all of you to make a free account, join, and read along to get a better understanding of how I could know it would crash, and how I would know that Bitcoin, which usually is quite silent on weekends, could crash even during this weekend at the time of current writing.
Long Term Levels: An emphasis on Macro economics, Monthly, Weekly and Daily timeframes. “MWD Bias Shift Levels”
Short Term Levels: An emphasis on economic releases, with Intraday charts on H1, 15m, 5m, 1m.
Intraday Levels: Become a PAID Subscriber.
Many of the views & opinions shared in this free blog is based on my much more advanced and in-depth analysis from my Founder content. I do NOT check for typos! This post may be edited to ADD content but NEVER DELETE trade-specific content
Thank you for taking your time reading and watching my content. I would appreciate if you would like/retweet/restack/comment to motivate and improve my production quality.
If I have time, I will comment on Crypto, Oil & Metals before tomorrow Monday, otherwise stay tuned in my General Chat and I will share as I see something. Crypto has been overwhelmingly boring and I may not be interested in it until something triggers.
My general market watchlist includes:
EURUSD, GBPUSD, Gold, Silver, Oil, SNP 500 , Nasdaq, Dow Jones, NQ/ES/YM, Bonds, Dollar, Commodity Futures and Crypto.
I share my general plans by way of arrows, which are based on the analysis I share in the Founder analysis videos. All my subscribers have access to these plans, but there is no guarantee I will be around to trade these plans in all my markets, so even if I miss a trade, it can be of use to you. For more precision, follow my live executions with a paid subscription. 7 day free trial is open.
If you want to see me execute trade ideas based around these trade prediction arrows, I highly recommend you become a paid subscriber. 7 day free trial available. If you want me to show you the analysis that justifies how I can predict the markets like this, I recommend you become a Founder.
Theo
Disclaimer: All views and opinions expressed in this blog are solely my own and are presented for educational purposes only, without the use of real money. All strategies, methods and concepts used by me, may one day, and suddenly, stop working. My weekly & daily studies may touch on subjects such as Futures, Stocks, Politics, Bonds, Forex, and Cryptocurrencies. I strongly advise against taking any action based on this content. Engaging in trading involves significant risk, and trading on margin can result in total loss of capital. You are solely responsible for your decisions, actions, trading, and investment choices. The blog’s contributors, including owners, writers, authors, moderators, and any mentioned entities or individuals, are not affiliated with any securities broker-dealers, investment advisors, or any regulatory authorities in the U.S., including the CFTC or the Securities and Exchange Commission. By reading this newsletter/blog, you explicitly agree to these terms. Any images or charts posted here are credited to TradingView & ForexFactory. All content on this blog is the intellectual property of the author. Do NOT share or copy any of the content on the blog without authorization from the author.
Yessssss