
Guide: How To Get In Sync With Trades & Investments ALREADY Shared LIVE
You may not always be able receive notifications or be available when a trade or investment idea is shared. This guide will use data and math to allow your to study along with a late perspective.

Foreword
At times, you may not be available to study along with me on trades and investments I share live. This can cause a problem, as you now do not have the same potential outcome as I do on a study of a trade or investment idea. Sometimes, you may get a better “entry” than me on a trade or investment, and at other times, perhaps more times, your entry will be worse.
With the assumption you have already read and understood the introduction & guide, that was posted here, including how to navigate the spreadsheets making the data ready and available for use, lets dive deeper and straight into an example of how to get into a trade that was late, with a papertrade or demo study.
Let’s go.
Get-In-Sync Rules Of Engagement:
Do NOT get in sync on trades & investments that have shared or have less than or equal to 3 star rating (3 positions in leverage) UNLESS AT or BETTER entry than what was shared. (Unless proven by data.)
On trades and investments with 4 or more rating, 4 positions, getting in sync is more likely favorable, but should still be before 1 RR is reached. (Unless proven by data.)
On trades and investments with get-in-sync entry ideas already above 3 RR in profit, are generally best avoided.
At least 1 AVAILABLE RR range for remaining targets is ideal, or more.
Beyond and above all else, USE THE DATA.
Study Example: CL / US Oil - How To Get In Sync.
Let us study the inception of this oil trade, which was shared at 04-22-2025, at a specific time of 03:19 UTC-4, or 03:19 New York time, but you were a full hour late.
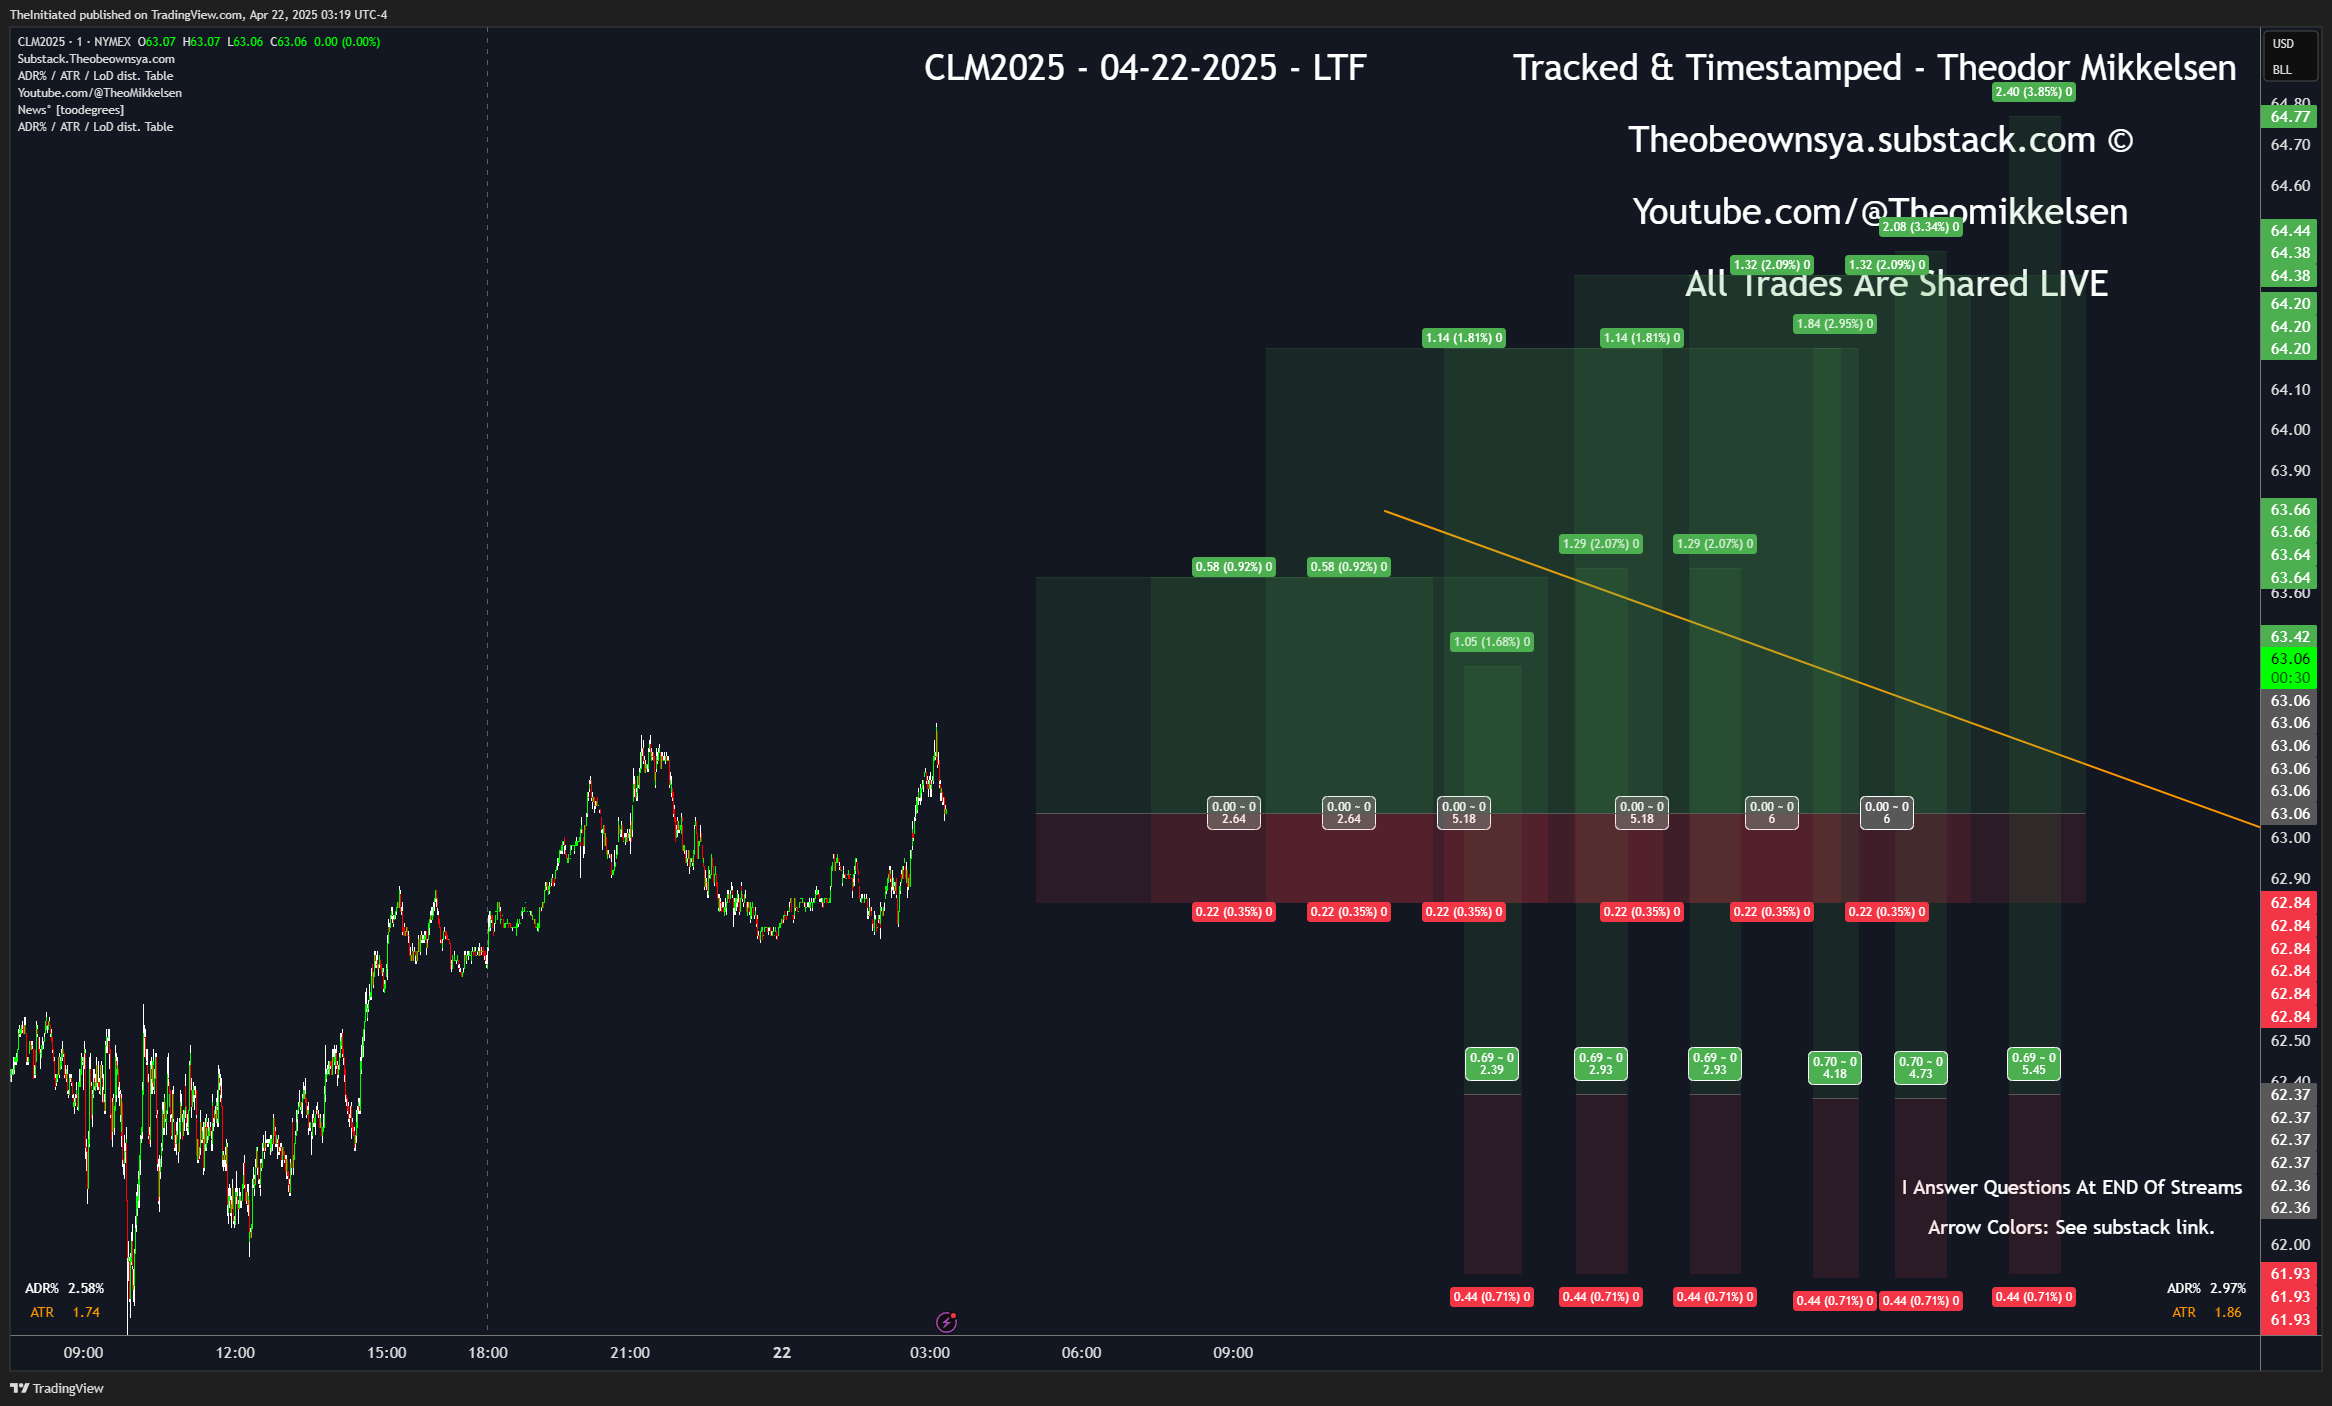
Moments later, price has reached into a proximity of the first target, and we are now up 2.27 RR.
But there are other targets remaining at 2.84, 5.18, and 6 RR. What do we do?
As the host and author of this service, I do not always go in and find setups for re-entries in markets that are already shared. I may do it, but I may not always. The purpose of these studies is to see whether or not the stoploss or first and remaining targets get hit, but this also means that we may get an opportunity to re-enter, but perhaps given the open risk and stoploss placement, I can’t share a new entry. Sometimes I do, in the provided chat threads.
Would we enter here 2.27 RR in profit, at a price of 63.56, when the target RR is 2.64?

Most likely not. The RR would be 0.26.
This means, without factoring in fees, we would need to be right more than 75% of the time entering this particular trade. In fact, I might not even have done it at all, even if you attempted to get in sync here, without any technical backing to do so.
The good news is, we have three key pieces of information from this blog we can use as a follower:
We know I am still in the trade. If I exited, took profits, I will update.
We know how many positions from 1 to 6 on the particular entry we have. From 1 to 6 will give us a star-rating and confidence rating. 5 positions remaining open or more is intended to be a really good edge, provided the data agrees. (Data does not always agree with the decision I make at the time.
We have the data.
So for point 2, we already know that 6 positions are in play for the target of 63.66. This means the trade, by my intention, has 70% profitability edge. (NOT winrate or probability of winning , but the net profit edge. Whenever you risk 100$, my conclusion would at the time be that we either make 70$ or lose 30$ on that trade whenever we take it. That is what I mean by edge.
This is good. It means my initial takeprofits have not been hit, and we can assume the trade is still live and shared with full confidence. When getting in sync with trades, we can now refer to our Rule Of Sync 1: If the shared trade or investment study has LESS than or equal to 3 positions / less than 3 trade rating, we should NEVER get in sync beyond the entry. Either AT or even better. In this case, we can enter with more confidence BEYOND the price, and get a worse entry in our study.
As mentioned, we are using the data to determine if a trade or investment idea shared should, at the time, have a probability of reaching a stoploss or an existing takeprofit. We can use the data to get insights on this.
For this, let us refer to trades and investments shared on the All-time and 90 day datasets for Oil, and see if we can get an understanding of what is going on:
By using the datasheet (link below)
Link To Datasheet - Scroll down a bit to find the Interactive Data Tool or use CTRL+F to search for it

We can make a copy of the existing version of the spreadsheet as a free viewer with access to the link, and make our selections here. (You can do the same!) And after a godawful waittime, probably 15 minutes or so, we will get a result that will tell us: What is the winrate, total RR, and average RR, on trades shared after 1st of January, 2025, across ALL ratings and ALL categories of Oil?
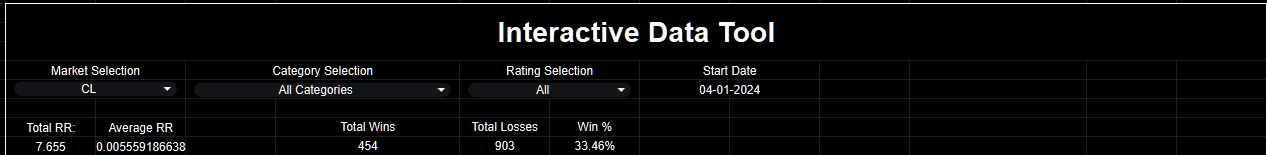

We can see on the basis of the data shared in the interactive tool, AND in the last 3 months tab also on the spreadsheet data, that oil is perhaps not the most profitable market to follow. Non the less, I have shared my trades there.
What can a Follower choose to do then?
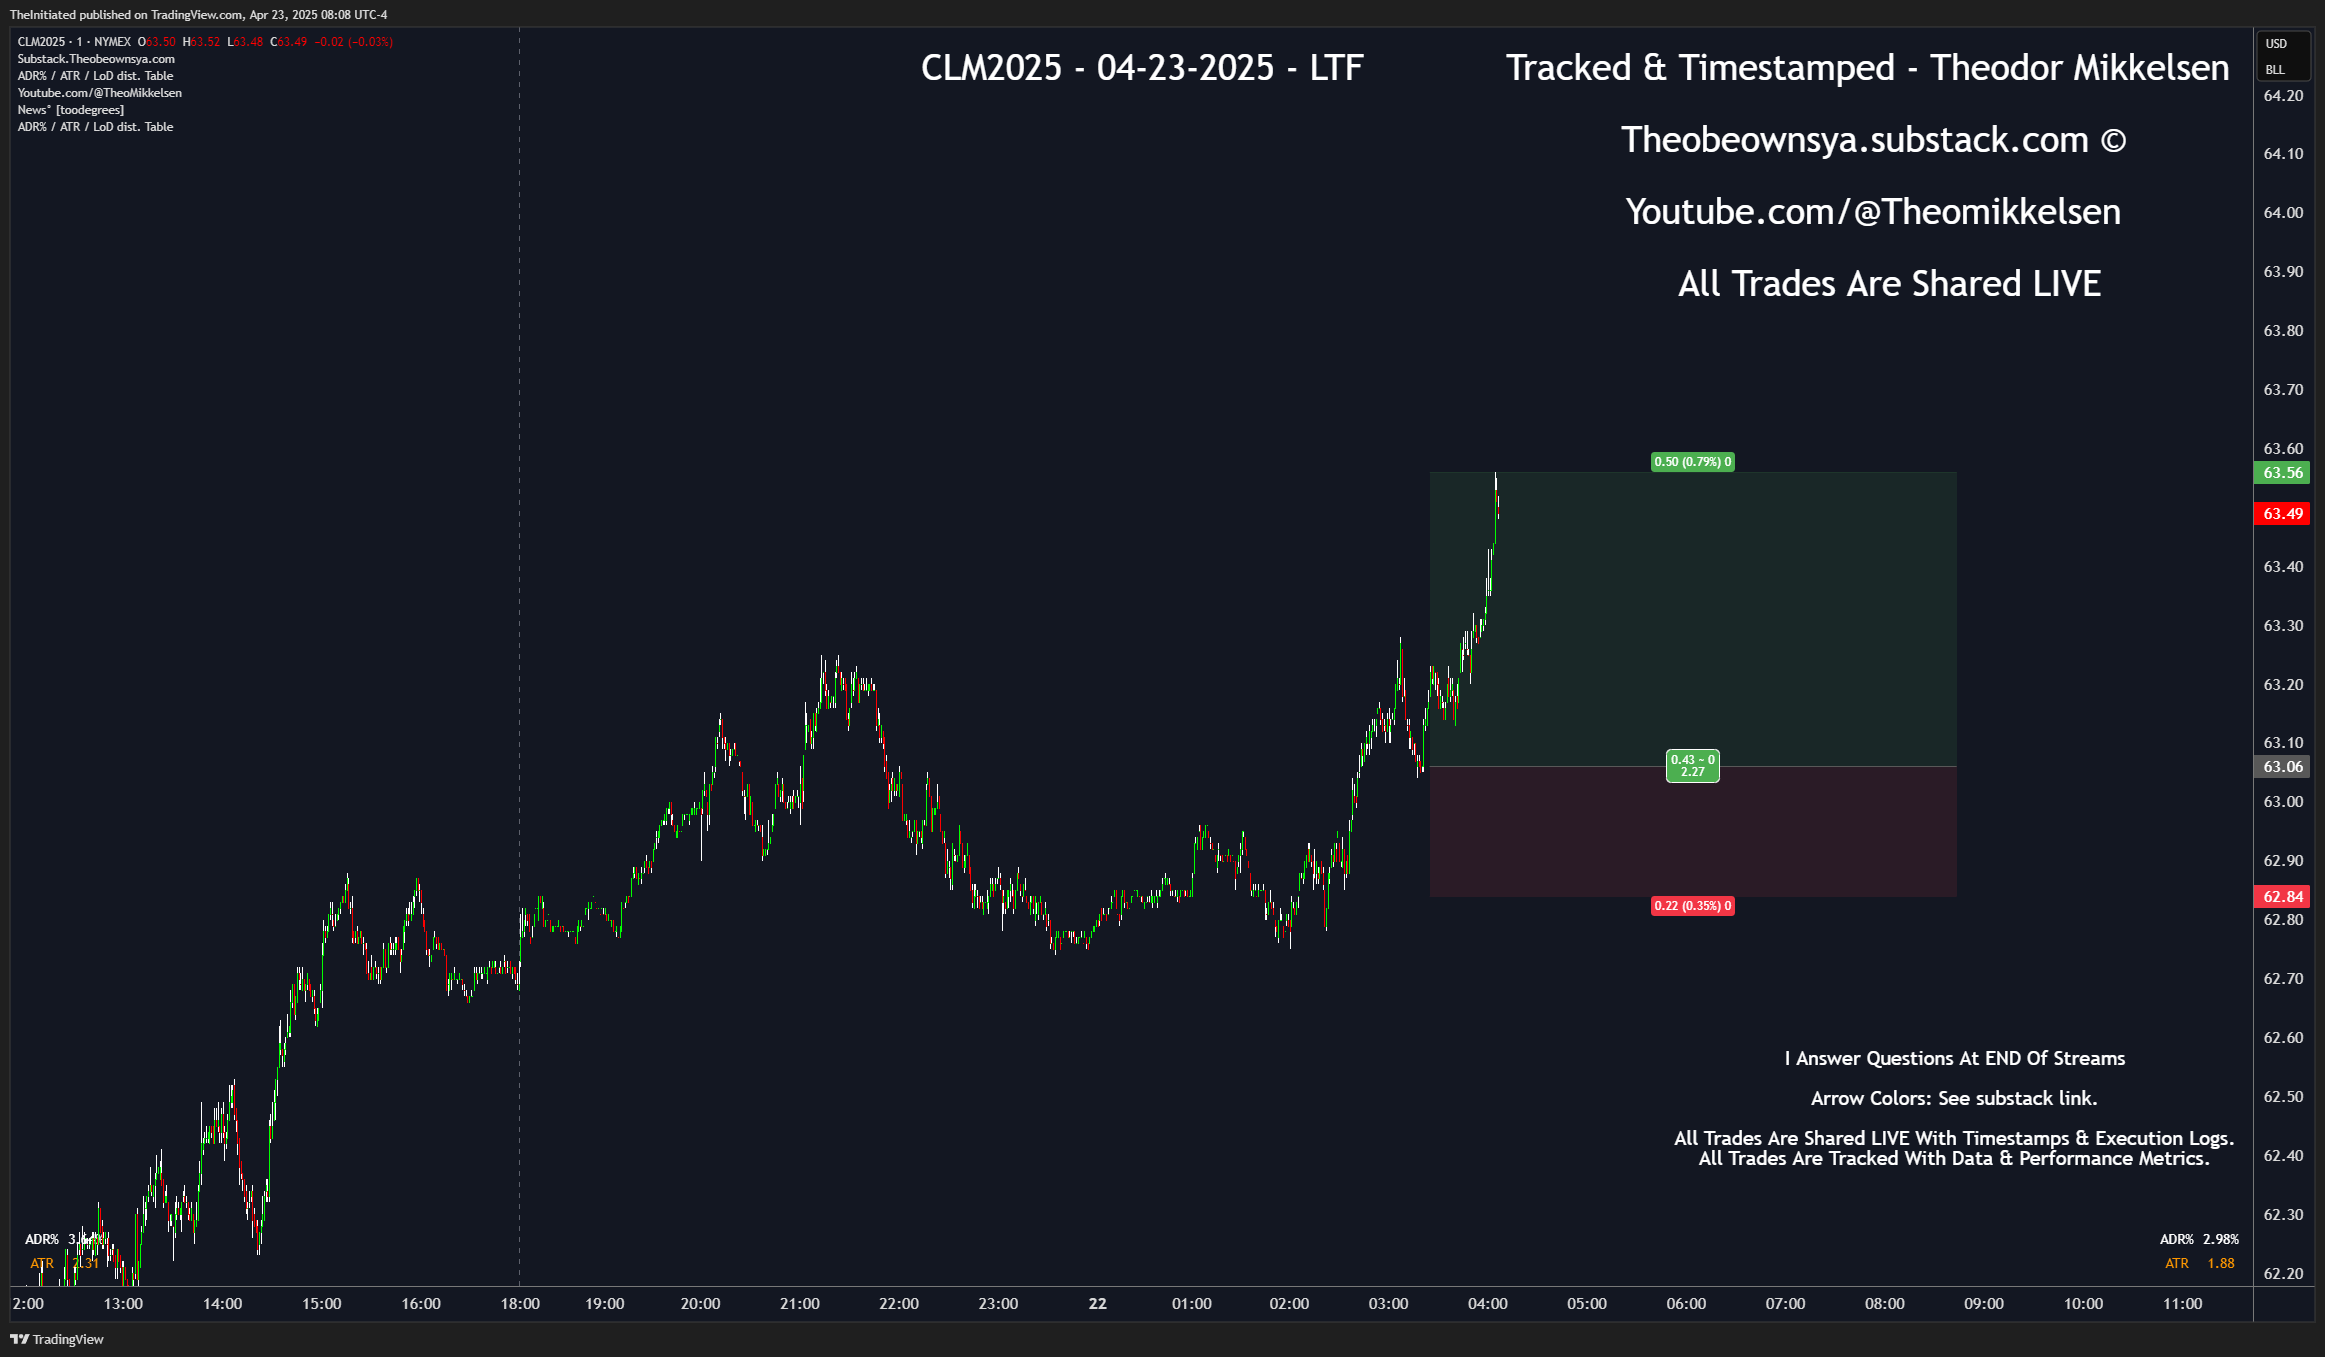
Well, let us take a look at one of my favorite markets, with a Trade on NQ:
On the second of April, I shared this trade:
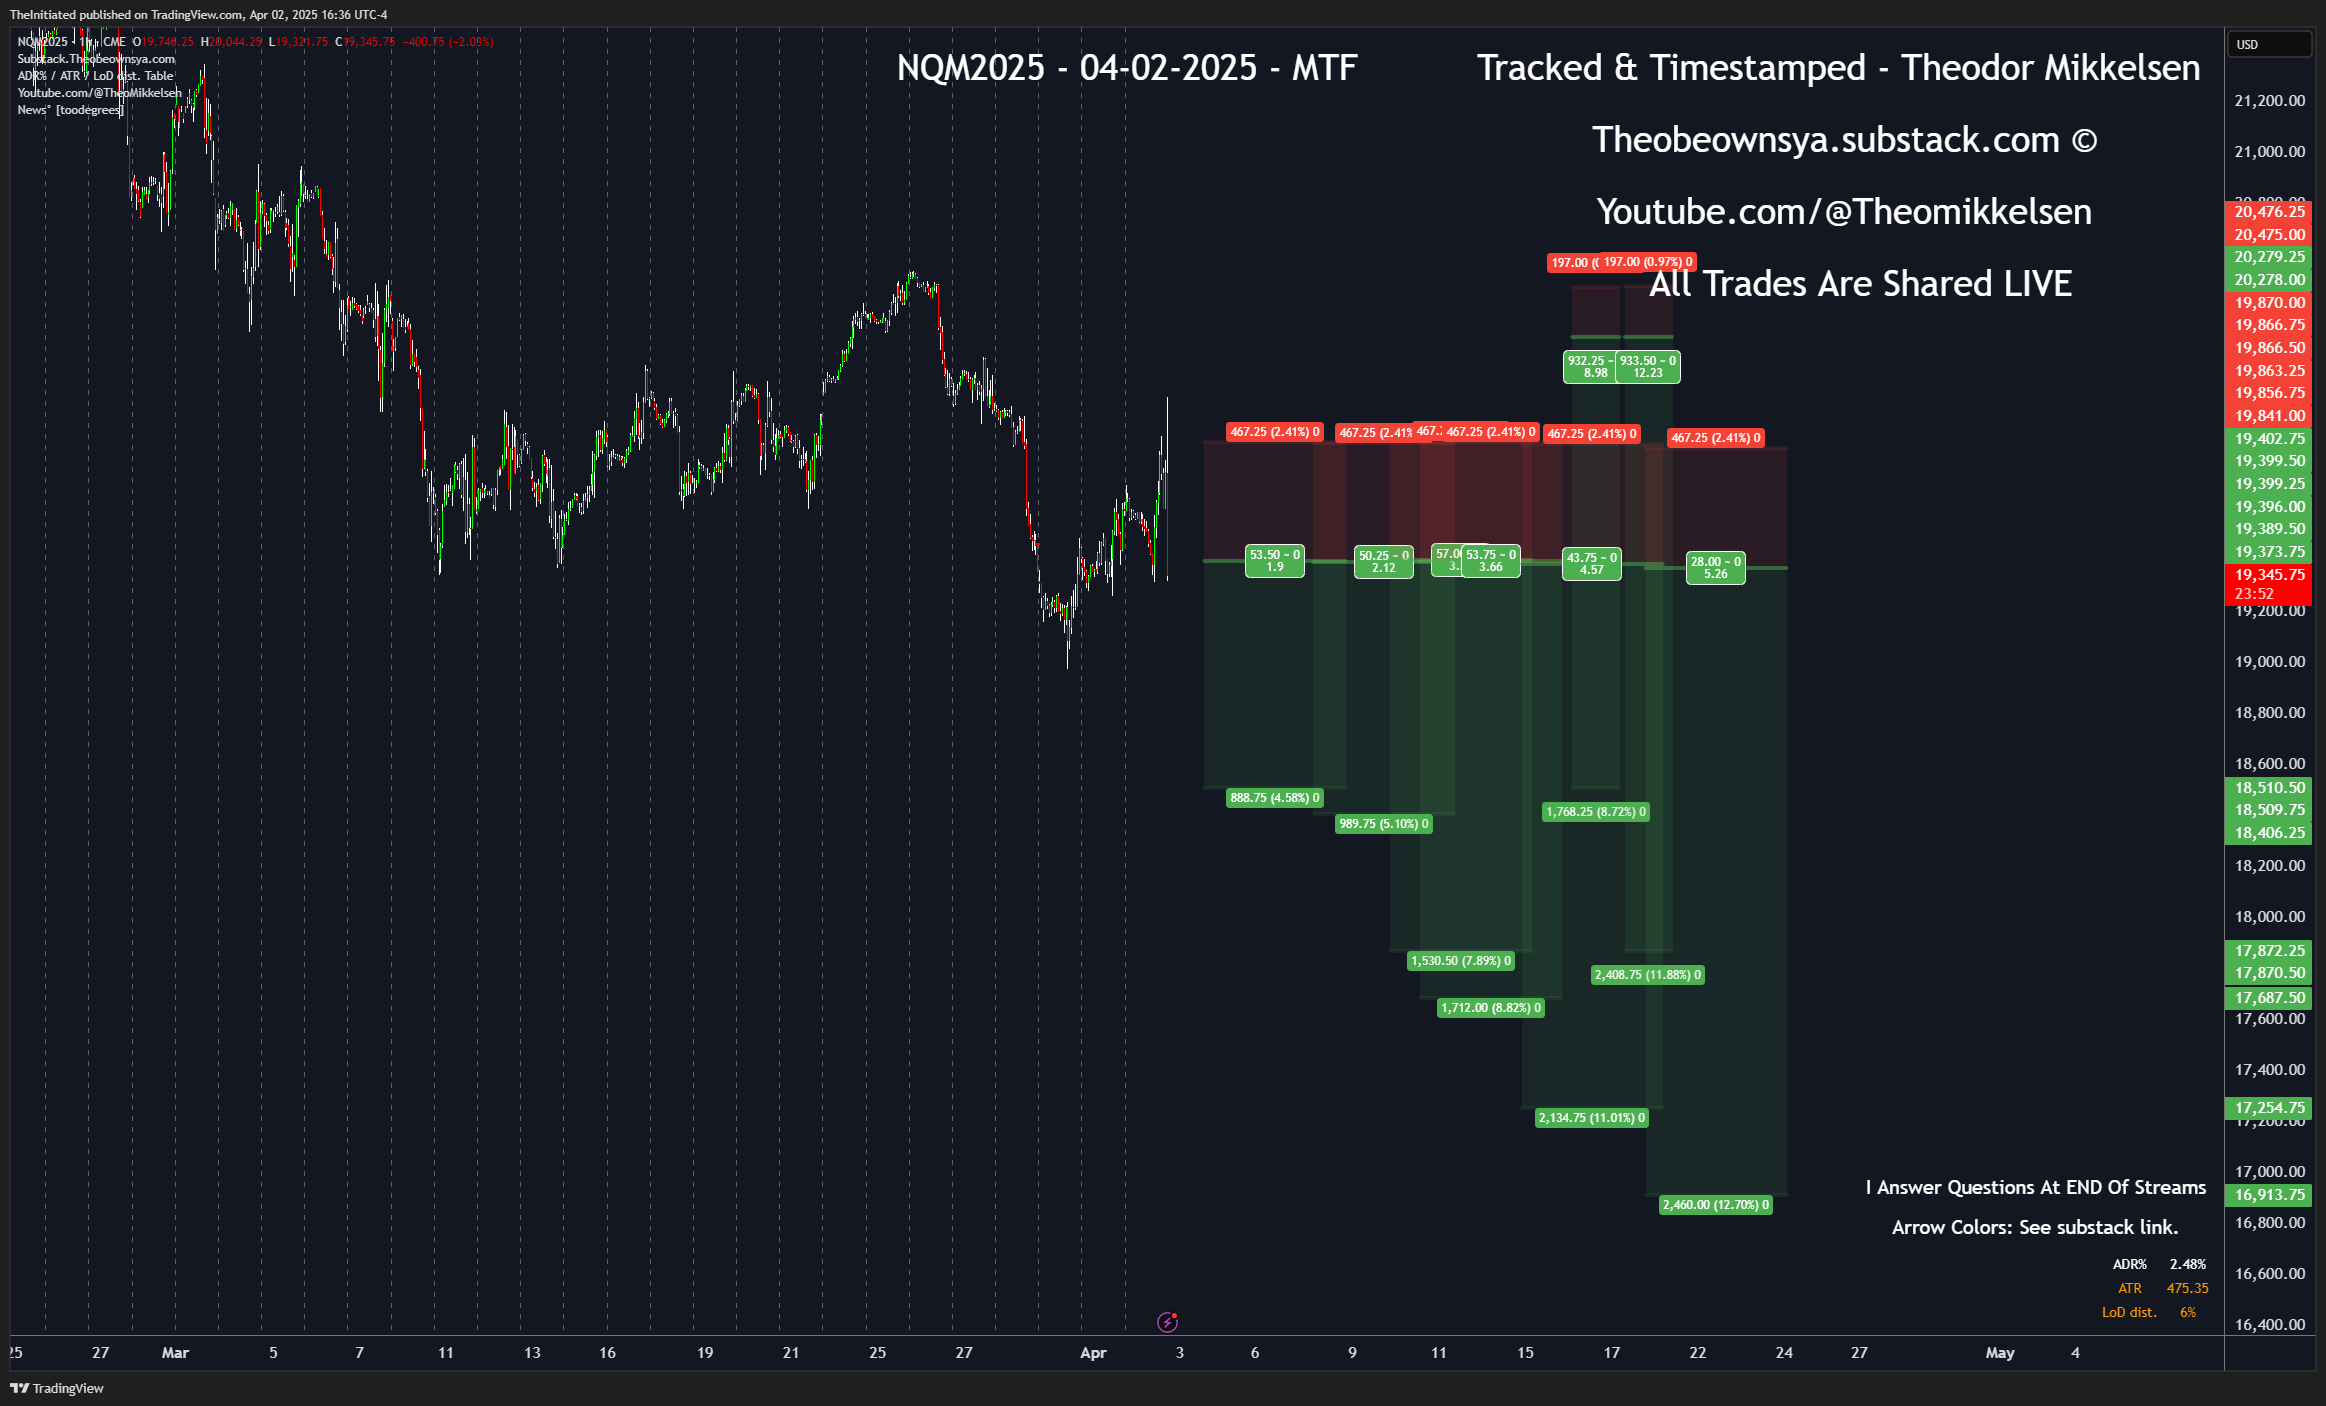
Let us plug in some data on the interactive tool. We already saw on the pre-set last 3 months general statistics tab that we have 0.5 RR per trade on over a whopping 1100 individual executions on NQ, while ES surprisingly, though at 600 trades, is at negative -0.07. So we could say, since they are correlated, the “effective” RR of both of them combined is somewhere around 0.3 to 0.35 RR per trade. Still very, very good for one market. This makes ES and NQ trade following a great contender.
if we narrow the result in to a start date of the 1st of September, 2024:
We can see a win-rate of 44% and average RR return of 0.33 RR. This data can in a NAKED format be plugged into a chatgpt calculation:

As such, as long as you enter before 0.45 RR or better (sometimes even better than the entries shared on the blog) - you will be in a data-historically profitable scenario.
But that is not to mention that the winrate is 44%. This is where remaining targets & remaining trades and lastly, remaining RR, comes in.
If I shared in this case 6 trades, and by the time you look to get in sync with it, we have four trades remaining at 3.5RR and 5 RR. We can use this information with the 44% winrate.
By asking the interactive tool, how many RR we are looking for as a takeprofit, for example we look to enter near 1 RR, and we got a remaining RR target of 2.5 remaining (1.5 effective RR, as I usually recommend at least 0.8 RR available for a trade entry) - we can study how many trades actually became 2.5 RR, out of the available data we have in the general format:

For the record, just because we HIT 2 or 2.5 RR this many times, does not mean we failed to get there. But it is a reflection on how many times we target 2 RR, as I am not keeping a record of “hypothetical” RR targets, this is the next best we got.
The point is, many times we may have an opportunity to enter at 0.5 or 1 RR; the naked data is good, and we can even factor in the fact that we got 4 or 5 or 6 positions remaining with more than 3 RR on the remaining targets, entering with more than 1 RR remaining in available range before those remaining targets can hit is statistically and logically advantageous.
Here we can promt ChatGPT again. You may have to think these things on the fly or by memory, but these are things I would be keeping in mind:
📊 From the chart:
Total Wins: 1049
Total Losses: 1265
Win Rate: 45.33%
Total RR (Profit): 781.9
Average RR per trade: ~0.33
Below is the win count at each RR milestone:
RR LevelReached Count0.587116781.544323212.519731473.51004844.566559
✅ To stay profitable as a copier:
You want your expected RR per trade (EV) to remain positive:
EV=(Win Rate)×(Target RR)−(1−Win Rate)×1\text{EV} = (\text{Win Rate}) \times (\text{Target RR}) - (1 - \text{Win Rate}) \times 1EV=(Win Rate)×(Target RR)−(1−Win Rate)×1
Solving:
Target RR>1−Win RateWin Rate\text{Target RR} > \frac{1 - \text{Win Rate}}{\text{Win Rate}}Target RR>Win Rate1−Win RateTarget RR>1−0.45330.4533≈1.206\text{Target RR} > \frac{1 - 0.4533}{0.4533} \approx 1.206Target RR>0.45331−0.4533≈1.206
So, a copier must enter at a point where they can still get ~1.2 RR or more, in order to break even.
📉 Based on the chart:
At RR 1.5, 443 of 1049 trades still reached that level → 42.23%
That is just below the win rate, but close.
At RR 2, it drops to 321 wins → 30.6%, which is no longer profitable with your base win rate. (Just a note: This is just a reflection of how many times we reached RR 2, without knowing how many times we aimed to reach it.)
✅ Conclusion:
If the copier cannot get in at the original 0 RR, they should only enter if they can still achieve at least ~1.2 RR.
Therefore, entering at 0.3 RR late (with 1.2 RR target left) may still be fine.
Entering at 1.5 RR remaining or less is still marginally profitable.
After 1.5 RR is missed, profitability drops, so entry beyond RR 1.5 becomes unprofitable for a copier based on your data. (Theo note: I agree with this.)
Let me know if you want the breakeven point recalculated for a different win rate or drawdown tolerance.
I will add to this that for every 1 RR you can add to the 1.2 RR, of available trades with at least 3 positions left, you will have a similar advantage. So entering at 1 RR, with targets of 3 RR+ left, (at least 1.2 RR left) is good.
A baseline of the data is having at least 1.2 RR left in the trade (or around 1 RR as I label it) is positive for the trade outcome, even with the disadvantage and potential further RR opportunism, had we known how often we would aim for higher RR targets.
As you can see, it is very possible to use the data provided for free in the overall blog performance to study when it is, or it is not, too late to enter on a trade, based on data, logic and a bit of AI prompting. With this, I hope it becomes more clear when you can, by muscle memory, follow along and study my studies with entries that may be slightly skewed.
Safe to say, if you enter with at least 0.5 RR in wiggle room you should be safe to follow along, as long as 1 RR in range or more is available from the entry you study at.
- Theo
CFTC Required Disclaimer: All views and opinions expressed in this blog are solely my own and are presented for educational purposes only, without the use of real money. All strategies, methods and concepts used by me, may one day, and suddenly, stop working. My weekly & daily studies may touch on subjects such as Futures, Stocks, Politics, Bonds, Forex, and Cryptocurrencies. I strongly advise against taking any real financial risk action based on this content. Engaging in trading involves significant risk, and trading on margin can result in total loss of capital. You are solely responsible for your decisions, actions, trading, and investment choices. The blog’s contributors, including owners, writers, authors, moderators, and any mentioned entities or individuals, are not affiliated with any securities broker-dealers, investment advisors, or any regulatory authorities in the U.S., including the CFTC or the Securities and Exchange Commission. By reading this newsletter/blog, you explicitly agree to these terms. Any images or charts posted here are credited to TradingView & ForexFactory. All content on this blog is the intellectual property of the author. Do NOT share or copy any of the content on the blog without authorization from the author.